National Housing Forecast 2020: Housing markets search for new balance
– Home price growth will flatten, with a forecasted increase of 0.8 percent
– Inventory will remain constrained, especially at the entry-level price segment
– Mortgage rates are likely to bump up to 3.88 percent by the end of the year
– Tight inventory and rising mortgage rates will lead to dropping sales
– Buyers will continue to move to affordability, benefiting mid-sized markets
Realtor.com Forecast for Key Housing Indicators
| Housing Indicator |
Realtor.com 2020 Forecast |
|
|
|
| Mortgage Rates |
Average 3.85% throughout the year, 3.88% by end of year |
|
|
|
| Existing Home Median Sales Price Appreciation |
Up 0.8% |
|
|
|
| Existing Home Sales |
Down 1.8% |
|
|
|
| Single-Family Home Housing Starts |
Up 6% |
|
|
|
| Homeownership Rate |
64.6% |
|
|
|

Download full resolution images: [Summary] [Full Infographic (15mb)]
Economic Perspectives
Gross Domestic Product
Economic activity in the United States started 2019 on an upbeat note, fueled by consumer optimism and business confidence. Riding the corporate tax restructuring of the 2017 Tax Cuts and Jobs Act, companies boosted investments and, coupled with solid consumer spending, led to a 4.1 percent annualized gain in gross domestic product (GDP) during the first quarter of the year, according to the Bureau of Economic Analysis. In addition, exports outpaced imports during the period, leading to expectations of increased trade windfalls.
However, as the year wore on, the trade rifts between the US and its trading partners deepened, leading to an escalation in tariffs and overall uncertainty. While consumer optimism remained unabated—leading to a 4.6 percent annualized gain in consumer spending—business confidence waned and resulted in a 1.0 percent drop in investment in the second quarter. Even as government spending picked up the pace, the cumulative effect was a mild 2.0 percent GDP gain in the second quarter.
The loss of momentum was reflected in the third quarter’s GDP figure, which advanced at an initial estimate of 1.9 percent annual rate. The Bureau of Economic Analysis subsequently revised third quarter GDP to 2.1 percent, showing stronger business investment. The Federal Reserve, concerned about a deteriorating global economic outlook, decided to boost liquidity in the financial system, in an effort to prevent an economic slide.
Monetary Policy
The Federal Reserve moved into 2019 signaling through its forward guidance that, as the economy continued on an expansionary track, it would maintain a policy focused on monetary tightening. Markets expected at least two additional short-term interest rate increases at the outset of the year.
Towards the midpoint of the year, however, the central bank’s policy shifted, in response to global changes. While the US economy continued showing signs of growth, major economies around the world slowed. In response to the slowdown, central banks around the world engaged in accommodative monetary responses, resorting to cutting rates and purchasing assets, in an effort to boost output. Along with the Bank of Japan, several central banks in Europe took interest rates into negative territory, attempting to spur investment and liquidity. In response, world currencies dropped against the US dollar, adding pressure on US exporters and sectors sensitive to currency risks.
The Federal Reserve decided to change tack in light of these shifts, and responded by cutting rates 3 times, at the Federal Open Market Committee’s meetings in July, September, and October. The central bank also expressed that it would move from a longer term outlook to a shorter term horizon, assessing incoming economic data through the year to guide its policy actions. While the bank’s two main objectives—stable employment and low inflation—remained on track in 2019, the rate cuts seemed aimed at walking a tightrope between maintaining US economic momentum amid a global economic moderation and placating investors’ expectations for growth.
Employment
Mirroring the shift in business confidence, the pace of employment growth moderated in the first three quarters of 2019. While companies continued adding positions to their payrolls, the number of net new jobs totaled 1.45 million during the January to September timeframe, 27 percent lower than the same period in 2018, based on data from the Bureau of Labor Statistics.
The professional and business services sector—the main driver of employment growth during the past decade—took a back seat to the healthcare and social assistance sector, accounting for 311,000 net new jobs, a 29 percent decline from 2018. With over 410,000 new jobs added to payrolls, the healthcare sector led the pack, posting a 19 percent gain compared with the same period in 2018. Stemming from solid growth in business travel, the lodging and food services sector provided the third largest number of net new jobs in the first nine months of 2019, with 136,000 employees added to payrolls.
As the corporate outlook dimmed partway through the year, employment in manufacturing, trade, transportation and utilities slowed. In addition, despite strong demand for housing, construction companies hired 58 percent fewer employees in 2019 compared with the prior year. The slowdown in hiring was also evident in other sectors, such as mining and logging, financial activities, as well as arts, entertainment and recreation.
Government entities also reflected shifting priorities in 2019. After an extended period of flat hiring, the federal government added 45,000 new positions during the first nine months of the year. Local governments—enjoying rising property tax revenues—also went on a hiring spree, adding 91,000 new employees to payrolls, a 44 percent increase year-over-year. State governments pared back their hiring, adding a more moderate 20,000 new jobs.
The pace of employment, while slower than a year ago, pushed the unemployment rate to 3.6 percent in the third quarter of 2019, the same rate last experienced in the second half of 1969. The labor force participation rate reached 62.8 percent in the third quarter of the year, slightly below the average rate recorded over the past decade. While wages gained ground during 2019, at 3.0 percent during the first half of the year, when adjusted for inflation, they managed a more modest 1.2 percent year-over-year average gain.
Consumer Confidence
Consumer confidence spent the better part of 2019 moving sideways, despite monthly fluctuations. In September, the Present Situation component of the Conference Board Consumer Confidence Index was unchanged compared with the same month in 2018. However, the Expectations component dropped 15 percent over the figure from the prior year, leading to an 8 percent decline in the overall index, and implying that consumers were expecting deteriorating conditions over the next few months.
2020 Economic Outlook
As economic momentum moderated through 2019 and global headwinds gather, GDP growth is projected to post a modest 1.7 percent advance in 2020. As the housing share of expenses continues rising, consumers—the largest contributor to output—will likely trim back on non-housing spending. A slowdown in consumer spending, coupled with rising global uncertainty and market volatility, can be expected to lead companies to contain costs and trim employment goals. An employment slowdown will move the unemployment rate from 3.6 percent at the start of 2020 to 3.9 percent by the end of the year—a jobless rate still below what would be expected in a healthy economy, but a shift in the wrong direction. In turn, consumer confidence will soften during the year, with the Conference Board’s Consumer Confidence Index estimated to decline 21 percent.
Following the Federal Reserve’s monetary accommodation, inflation expectations remain modest and well-anchored, translating into a 2.0 percent year-over-year increase in 2020. While short term rates remain low, economic moderation is likely to impact bond markets, leading to mortgage rates moving mostly sideways in 2020. Rates for 30-year fixed mortgages are projected to average 3.85 percent during the next year.
Housing Trends in 2020

Download full resolution images: [Inventory Outlook] [Full Infographic (15mb)]
1) Supply
Housing supply was a tale of two halves in 2019. In the first six months, we saw the effect of low affordability, which translated into an inventory build-up around the country. The number of homes available for sale rose rapidly, at nearly 7 percent on a yearly basis, the fastest pace of growth since 2014. Before spring arrived we had already seen the first material move in favor of buyers. Inventory was on an expansionary path leading to the summer, as prices further overheated and frustrated buyers reached a point of exhaustion. However, the landscape shifted quickly. As mortgage rates sank in March, the low rate environment gave the housing market a second wind. Thousands of buyers that were priced out by sky-high prices found a way to enter the market by leaning on financing, and those that were on the edge of qualifying were suddenly and automatically back in. At the start of this year, 2-out-of-3 of markets were seeing inventory growth. As we wrap the year, only 1-in-10 are seeing growth, placing housing into acute shortage mode.
The market is still years away from reaching an adequate supply of homes to meet today’s demand from buyers. Despite improvements to new construction and short waves of sellers, next year will once again fail to bring a solution to the inventory shortage. In 2020, we expect inventory to struggle to grow and could instead reach a historic low level. The yearly declines are likely to be moderate and range between 1-to-5 percent for most of the year. A steady flow of demand, and robust-yet-declining seller sentiment will combine to ensure there is no surplus adequately-priced inventory.
2) Demand
A low rate environment, rising rents, and the ever expanding millennial population broadened the potential homebuyer pool and maintained a strong demand foundation in 2019. Buyer sentiment peaked in the summer and powered sales growth in the fall. However, it lost momentum later in the year, as conditions of low affordability and economic uncertainty persisted.
Overall buyer demand will remain very robust, particularly at the entry level, in 2020. The largest population cohort in the country (those born in 1990) will turn 30 in 2020, accounting for 4.8 million millennials hitting peak home buying age. As a group, Millennials (those born 1981-1997) will take more than half of all mortgages next year. For the first time ever, Millennials’ share of mortgage originations will surpass 50 percent in the spring, outnumbering Gen X and Baby Boomers combined. The last generation to take more than half of all purchase originations was Gen X in 2013, just six years ago. Accordingly, other generations’ footprint will continue to contract, with Gen X and Baby Boomers taking 32 and 17 percent of mortgage originations respectively.
3) Home sales
Sales of existing homes declined in 2018 and through the first half of 2019, as tightening inventory squeezed first-time buyers. While sales experienced a slight rebound in the third quarter of this year, elevated by declining mortgage rates, the annual pace is likely to be flat at best. Demand for homes remains solid, with younger buyers continuing to vote with their dollars. However, as consumers indicated that they expect a moderation in economic activity in 2020, the housing market is likely to reflect the economic headwinds. Sales of existing homes are expected to decline 1.8 percent in 2020, as the continuing supply shortage and moderating price growth will hamper buyers and tamp down sellers’ expectations.
The decline in sales is projected to be accompanied by a flattening in price growth. With the supply of available homes continuing to balance on a tightrope, and the entry-level demand expected to remain strong, prices are estimated to tick up 0.8 percent in 2020.
4) Move to affordability
A dominant trait of this real estate cycle has been the renaissance of the urban downtowns. As younger generations returned to downtown cores, employers and developers responded by building offices, retail and housing in high-density environments. However, as the costs of development and construction rose, so did housing prices, especially given the propensity for builders to bring mostly high-end, luxury products to market. Over the past decade, demand for downtown living trended on an upward curve, driven by a desire for proximity, and lifestyle amenities, especially on the part of Millennials.
However, as Millennials matured and started families, their priorities shifted. With the oldest members of the generational cohort reaching 38 years in 2019, Millennials broadened their housing horizons beyond the urban core. As housing prices outpaced incomes by a wide margin, home buyers made a noticeable move toward affordability during the year. Large, expensive coastal markets—New York, Los Angeles, San Francisco—began experiencing net migration outflows, as buyers flocked to mid-sized cities, in search of quality of life and amenities at a more affordable price point.
The move to affordability trend will continue in 2020, fueled by the twin forces of Baby Boomers retiring and seeking sunnier weather, lower taxes and lower cost of living, and Millennials searching for family-friendly lifestyles and affordable housing. Home buyers are increasingly looking not only at suburban environments near large metropolitan areas, but also considering options across state lines. Cities in Arizona, Nevada and Texas will continue to benefit from shoppers looking for more affordable alternatives to California. Meanwhile, shoppers from expensive Northeast markets will find the warmer options in the Carolinas, Georgia and Florida attractive.
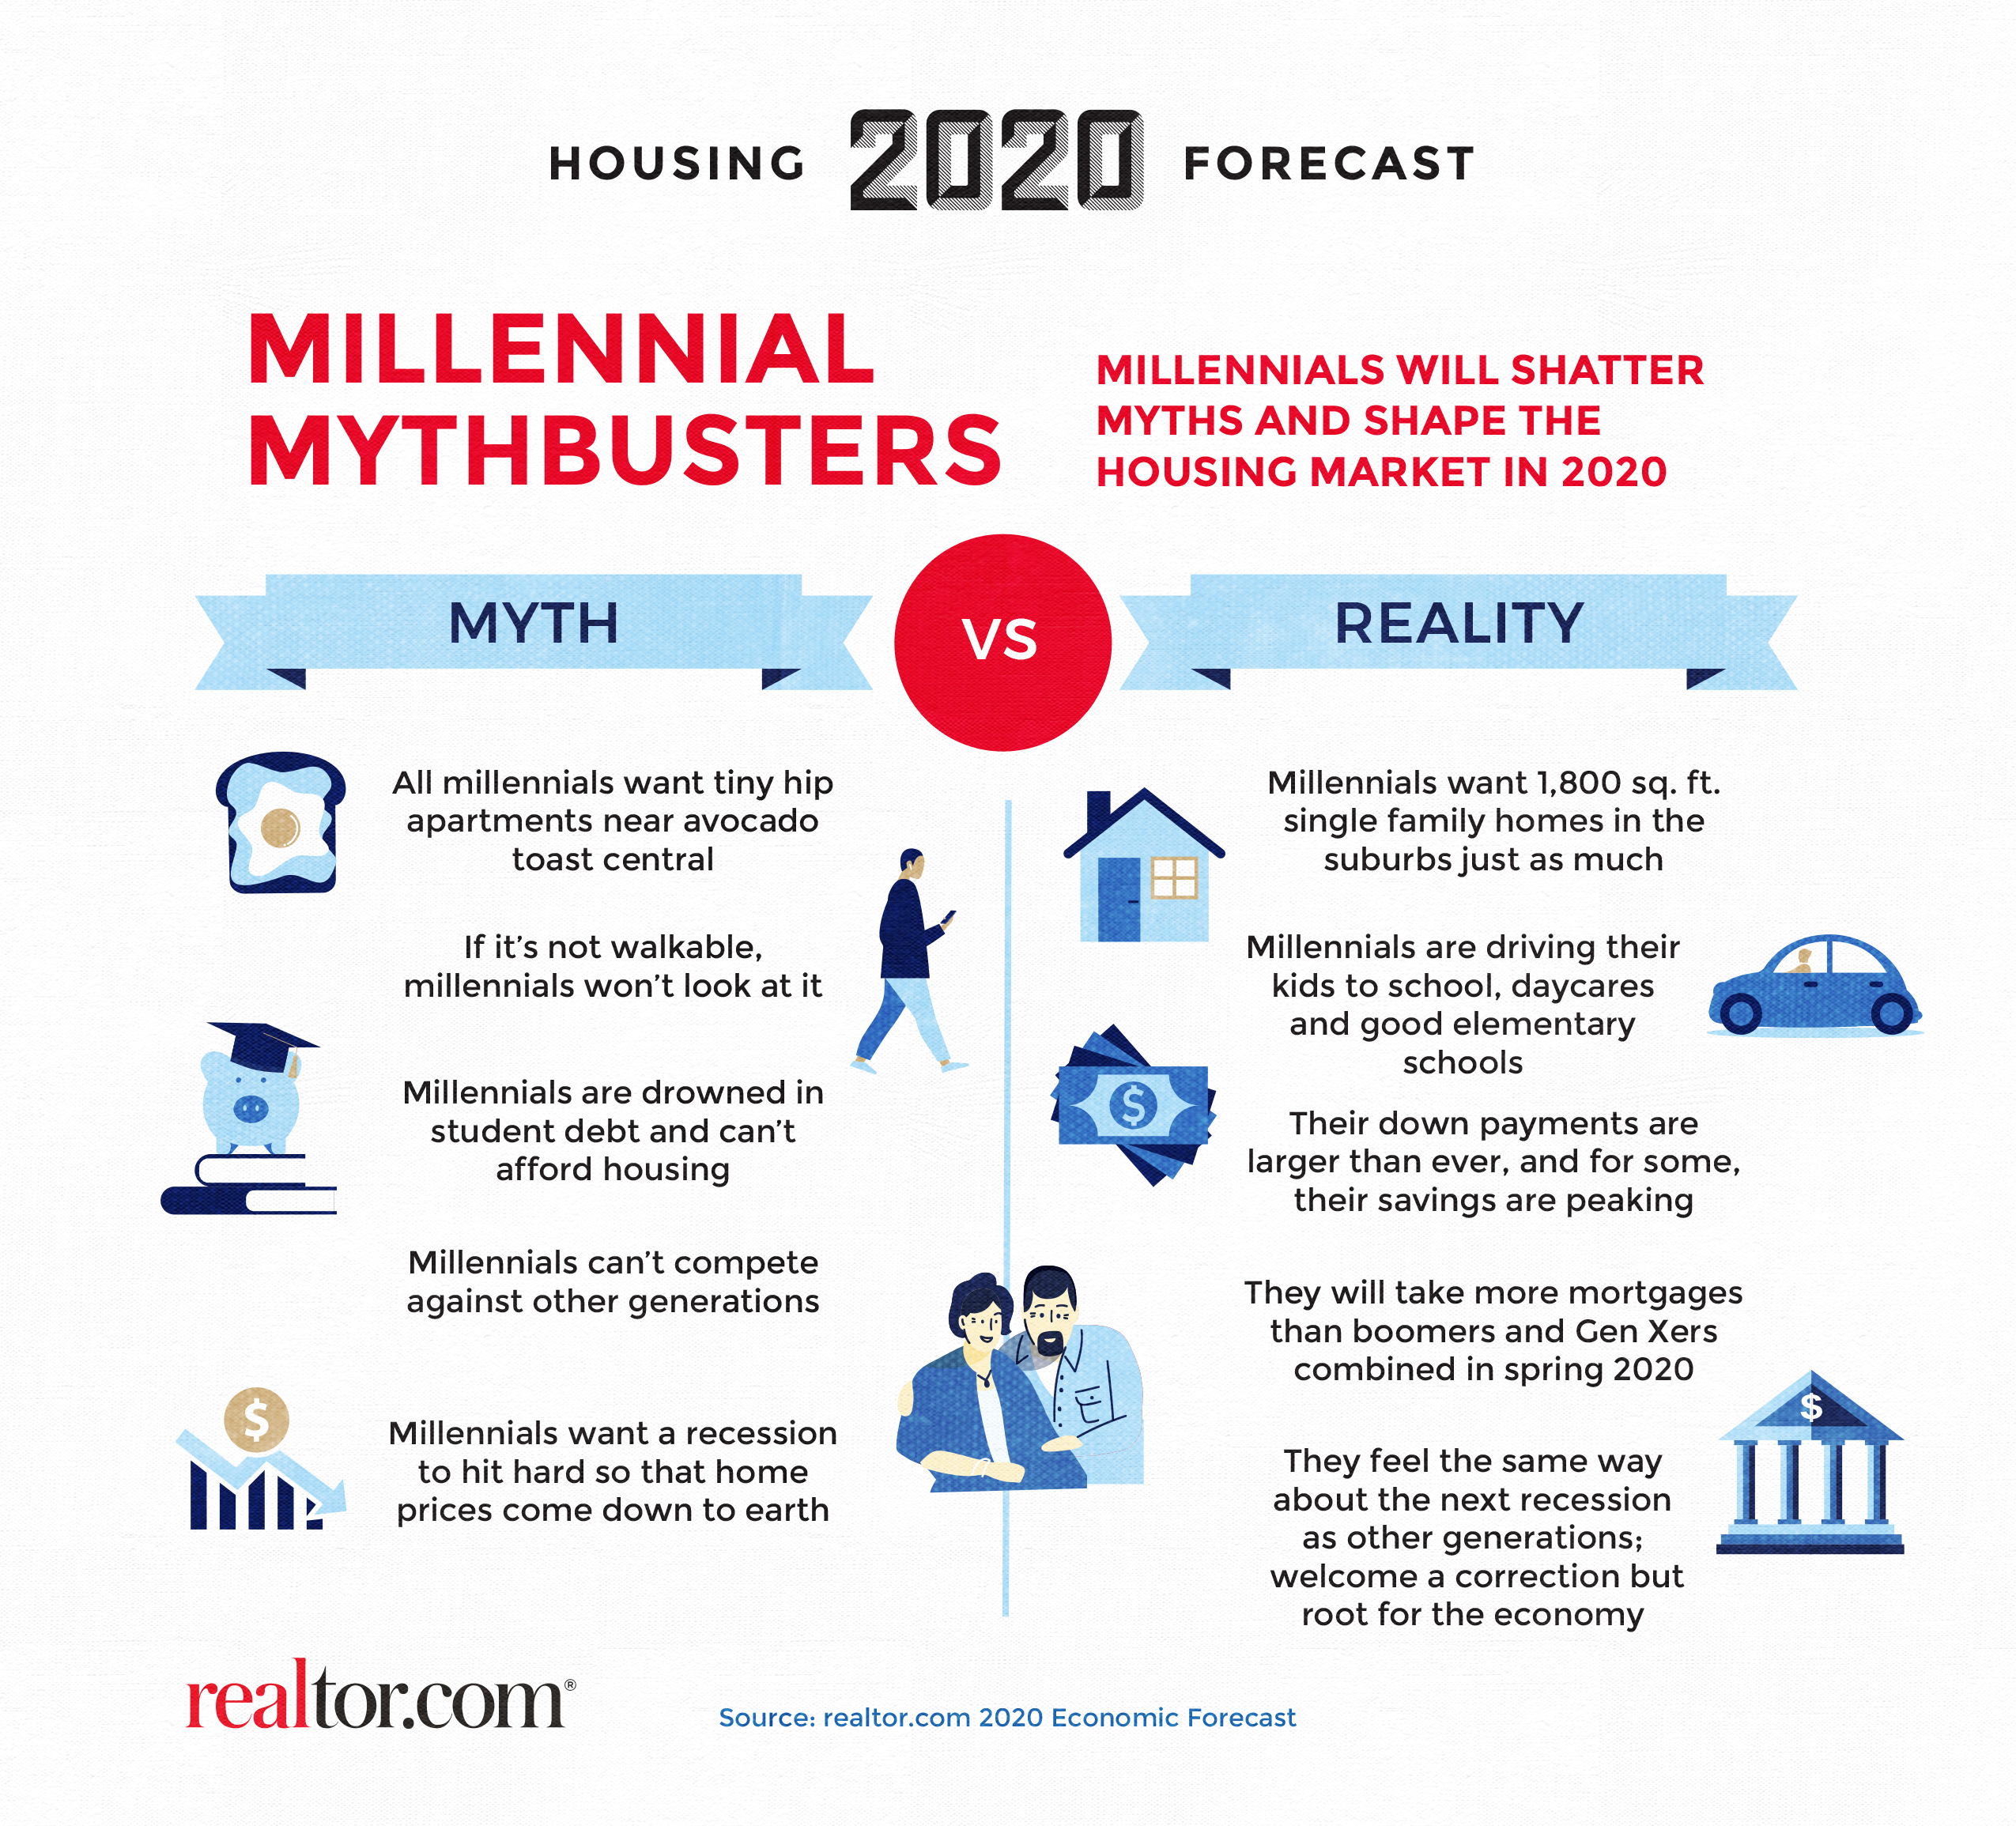
Download full resolution images: [Millennial Mythbusters] [Full Infographic (15mb)]
What will 2020 be like for buyers?
Buying a home in 2020 will offer opportunities for some buyers, as the supply of new homes relieves some of the inventory pressures, and prices moderate. While the inventory of new homes in 2019 remained focused on the high-end, as the luxury market cools, builders signaled their intent to increase offerings in the mid-price segment, a much-needed shift in market dynamics. First-time buyers will continue to struggle with affordability, even with mortgage rates in an approachable range, as entry-level inventory is expected to remain constrained. The broad price moderation will continue to offer opportunities in mid-sized markets in the Midwest and South.
What will 2020 be like for sellers?
Sellers in 2020 will contend with flattening price growth and slowing activity, requiring more patience and a thoughtful approach to pricing. Sellers of homes priced for entry-level buyers can expect the market to remain competitive and prices to stay firm. At the upper end of the price range, however, properties will take longer to sell, and incentives will be needed to close deals. As the market moves toward a more balanced scenario, sellers who adjust to local market conditions can expect to benefit from continuing demand.

Download full resolution images: [Implications for Buyers and Sellers] [Full Infographic (15mb)]
Election will be 2020 wildcard
Political elections can have an impact on the economy and housing markets. While the outcome of elections is not directly tied to the performance of the markets, expectations linked to a party’s or an administration’s likely legislative or regulatory actions can sway confidence and decisions. When either party gains control of the legislative and executive branches, there’s a higher likelihood of seeing shifts in the rule-making process and the regulatory environment.
Looking at housing trends over the past three decades, the pace of sales, price and inventory are intertwined with economic performance—employment, wages, and interest rates. The outcome of elections does not weigh directly on trends in housing. However, business optimism and investments, along with consumer optimism and spending do influence economic output, and can also influence housing activity.
The 2020 elections will be closely watched by consumers and businesses for indications of potential changes. Along with the presidential election, there will be candidates running for 35 of the 100 seats in the U.S. Senate, along with 435 seats in the House of Representatives.
Housing Market Predictions 2020 – City Breakdown
| Housing Market |
Sales Growth |
Price Growth |
|
|
|
|
|
| United States |
-1.8% |
0.8% |
|
|
|
|
|
| Akron, Ohio |
2.6% |
0.0% |
|
|
|
|
|
| Albany-Schenectady-Troy, N.Y. |
-0.5% |
2.3% |
|
|
|
|
|
| Albuquerque, N.M. |
-0.2% |
0.9% |
|
|
|
|
|
| Allentown-Bethlehem-Easton, Pa.-N.J. |
2.3% |
0.4% |
|
|
|
|
|
| Atlanta-Sandy Springs-Roswell, Ga. |
-3.5% |
4.5% |
|
|
|
|
|
| Augusta-Richmond County, Ga.-S.C. |
-4.2% |
2.1% |
|
|
|
|
|
| Austin-Round Rock, Texas |
-2.8% |
-0.2% |
|
|
|
|
|
| Bakersfield, Calif. |
-0.3% |
-1.4% |
|
|
|
|
|
| Baltimore-Columbia-Towson, Md. |
-0.1% |
-0.3% |
|
|
|
|
|
| Baton Rouge, La. |
-1.6% |
0.4% |
|
|
|
|
|
| Birmingham-Hoover, Ala. |
-1.3% |
-1.1% |
|
|
|
|
|
| Boise City, Idaho |
0.3% |
8.1% |
|
|
|
|
|
| Boston-Cambridge-Newton, Mass.-N.H. |
-2.1% |
1.2% |
|
|
|
|
|
| Bridgeport-Stamford-Norwalk, Conn. |
-4.1% |
4.8% |
|
|
|
|
|
| Buffalo-Cheektowaga-Niagara Falls, N.Y. |
2.6% |
-2.2% |
|
|
|
|
|
| Cape Coral-Fort Myers, Fla. |
0.0% |
2.6% |
|
|
|
|
|
| Charleston-North Charleston, S.C. |
1.2% |
1.9% |
|
|
|
|
|
| Charlotte-Concord-Gastonia, N.C.-S.C. |
0.4% |
0.1% |
|
|
|
|
|
| Chattanooga, Tenn.-Ga. |
2.0% |
3.6% |
|
|
|
|
|
| Chicago-Naperville-Elgin, Ill.-Ind.-Wis. |
-0.9% |
-0.3% |
|
|
|
|
|
| Cincinnati, Ohio-Ky.-Ind. |
1.3% |
0.3% |
|
|
|
|
|
| Cleveland-Elyria, Ohio |
2.6% |
0.4% |
|
|
|
|
|
| Colorado Springs, Colo. |
-1.4% |
6.3% |
|
|
|
|
|
| Columbia, S.C. |
5.5% |
-0.2% |
|
|
|
|
|
| Columbus, Ohio |
-2.0% |
1.7% |
|
|
|
|
|
| Dallas-Fort Worth-Arlington, Texas |
-4.9% |
-0.5% |
|
|
|
|
|
| Dayton, Ohio |
0.6% |
-0.2% |
|
|
|
|
|
| Deltona-Daytona Beach-Ormond Beach, Fla. |
1.1% |
0.2% |
|
|
|
|
|
| Denver-Aurora-Lakewood, Colo. |
-2.3% |
1.7% |
|
|
|
|
|
| Des Moines-West Des Moines, Iowa |
-10.5% |
0.4% |
|
|
|
|
|
| Detroit-Warren-Dearborn, Mich |
-4.1% |
-1.0% |
|
|
|
|
|
| Durham-Chapel Hill, N.C. |
-0.9% |
1.2% |
|
|
|
|
|
| El Paso, Texas |
0.9% |
0.6% |
|
|
|
|
|
| Fresno, Calif. |
-0.7% |
-0.9% |
|
|
|
|
|
| Grand Rapids-Wyoming, Mich |
-4.2% |
0.2% |
|
|
|
|
|
| Greensboro-High Point, N.C. |
0.8% |
-2.9% |
|
|
|
|
|
| Greenville-Anderson-Mauldin, S.C. |
-2.5% |
0.1% |
|
|
|
|
|
| Harrisburg-Carlisle, Pa. |
0.3% |
0.5% |
|
|
|
|
|
| Hartford-West Hartford-East Hartford, Conn. |
-3.0% |
2.7% |
|
|
|
|
|
| Houston-The Woodlands-Sugar Land, Texas |
0.3% |
0.2% |
|
|
|
|
|
| Indianapolis-Carmel-Anderson, Ind. |
0.0% |
1.1% |
|
|
|
|
|
| Jackson, Miss. |
-2.1% |
-0.1% |
|
|
|
|
|
| Jacksonville, Fla. |
-2.3% |
0.7% |
|
|
|
|
|
| Kansas City, Mo.-Kan. |
3.4% |
-4.0% |
|
|
|
|
|
| Knoxville, Tenn. |
1.6% |
1.3% |
|
|
|
|
|
| Lakeland-Winter Haven, Fla. |
-0.9% |
0.2% |
|
|
|
|
|
| Las Vegas-Henderson-Paradise, Nev. |
-9.5% |
-1.1% |
|
|
|
|
|
| Little Rock-North Little Rock-Conway, Ark. |
-2.6% |
1.0% |
|
|
|
|
|
| Los Angeles-Long Beach-Anaheim, Calif. |
-6.0% |
0.7% |
|
|
|
|
|
| Louisville/Jefferson County, Ky.-Ind. |
-0.8% |
0.9% |
|
|
|
|
|
| Madison, Wis. |
-1.3% |
1.9% |
|
|
|
|
|
| McAllen-Edinburg-Mission, Texas |
4.4% |
4.0% |
|
|
|
|
|
| Memphis, Tenn.-Miss.-Ark. |
0.1% |
3.0% |
|
|
|
|
|
| Miami-Fort Lauderdale-West Palm Beach, Fla. |
-1.1% |
-1.2% |
|
|
|
|
|
| Milwaukee-Waukesha-West Allis, Wis. |
-3.6% |
2.1% |
|
|
|
|
|
| Minneapolis-St. Paul-Bloomington, Minn.-Wis. |
-2.4% |
2.8% |
|
|
|
|
|
| Nashville-Davidson–Murfreesboro–Franklin, Tenn. |
-1.2% |
0.4% |
|
|
|
|
|
| New Haven-Milford, Conn. |
5.0% |
-2.4% |
|
|
|
|
|
| New Orleans-Metairie, La. |
-2.3% |
-0.7% |
|
|
|
|
|
| New York-Newark-Jersey City, N.Y.-N.J.-Pa. |
-4.1% |
0.7% |
|
|
|
|
|
| North Port-Sarasota-Bradenton, Fla. |
1.6% |
0.5% |
|
|
|
|
|
| Oklahoma City, Okla. |
-1.4% |
-0.8% |
|
|
|
|
|
| Omaha-Council Bluffs, Neb.-Iowa |
-3.0% |
0.7% |
|
|
|
|
|
| Orlando-Kissimmee-Sanford, Fla. |
0.9% |
1.8% |
|
|
|
|
|
| Oxnard-Thousand Oaks-Ventura, Calif. |
-6.0% |
0.1% |
|
|
|
|
|
| Palm Bay-Melbourne-Titusville, Fla. |
-9.8% |
0.2% |
|
|
|
|
|
| Philadelphia-Camden-Wilmington, Pa.-N.J.-Del.-Md. |
-3.9% |
0.8% |
|
|
|
|
|
| Phoenix-Mesa-Scottsdale, Ariz. |
-0.4% |
3.4% |
|
|
|
|
|
| Pittsburgh, Pa. |
-0.6% |
1.3% |
|
|
|
|
|
| Portland-South Portland, Maine |
1.4% |
1.2% |
|
|
|
|
|
| Portland-Vancouver-Hillsboro, Ore.-Wash. |
-3.0% |
0.5% |
|
|
|
|
|
| Providence-Warwick, R.I.-Mass. |
-2.1% |
0.2% |
|
|
|
|
|
| Raleigh, N.C. |
0.2% |
2.2% |
|
|
|
|
|
| Richmond, Va. |
-7.7% |
0.6% |
|
|
|
|
|
| Riverside-San Bernardino-Ontario, Calif. |
-7.6% |
1.5% |
|
|
|
|
|
| Rochester, N.Y. |
4.7% |
0.4% |
|
|
|
|
|
| Sacramento–Roseville–Arden-Arcade, Calif. |
-6.1% |
0.8% |
|
|
|
|
|
| Salt Lake City, Utah |
-0.5% |
3.5% |
|
|
|
|
|
| San Antonio-New Braunfels, Texas |
-1.9% |
0.8% |
|
|
|
|
|
| San Diego-Carlsbad, Calif. |
-3.2% |
0.2% |
|
|
|
|
|
| San Francisco-Oakland-Hayward, Calif. |
-4.5% |
-0.4% |
|
|
|
|
|
| San Jose-Sunnyvale-Santa Clara, Calif. |
-3.0% |
2.1% |
|
|
|
|
|
| Scranton–Wilkes-Barre–Hazleton, Pa. |
-2.7% |
-3.2% |
|
|
|
|
|
| Seattle-Tacoma-Bellevue, Wash. |
-0.8% |
3.1% |
|
|
|
|
|
| Spokane-Spokane Valley, Wash. |
1.5% |
1.3% |
|
|
|
|
|
| Springfield, Mass. |
0.3% |
1.1% |
|
|
|
|
|
| St. Louis, Mo.-Ill. |
-1.2% |
-0.6% |
|
|
|
|
|
| Stockton-Lodi, Calif. |
0.7% |
-0.5% |
|
|
|
|
|
| Syracuse, N.Y. |
-1.4% |
0.6% |
|
|
|
|
|
| Tampa-St. Petersburg-Clearwater, Fla. |
0.6% |
1.6% |
|
|
|
|
|
| Toledo, Ohio |
0.5% |
-0.1% |
|
|
|
|
|
| Tucson, Ariz. |
3.4% |
3.3% |
|
|
|
|
|
| Tulsa, Okla. |
1.0% |
-2.3% |
|
|
|
|
|
| Urban Honolulu, Hawaii |
3.6% |
-0.9% |
|
|
|
|
|
| Virginia Beach-Norfolk-Newport News, Va.-N.C. |
-3.8% |
1.1% |
|
|
|
|
|
| Washington-Arlington-Alexandria, DC-Va.-Md.-W. Va. |
-1.5% |
2.6% |
|
|
|
|
|
| Wichita, Kan. |
-0.5% |
1.1% |
|
|
|
|
|
| Winston-Salem, N.C. |
3.6% |
0.5% |
|
|
|
|
|
| Worcester, Mass.-Conn. |
-0.4% |
-0.6% |
|
|
|
|
|
| Youngstown-Warren-Boardman, Ohio-Pa. |
-0.4% |
2.1% |